2024 is off to a strong start with the S&P 500 having its best start since 2019 and continuing the momentum that began in Q423. Since the “risk on” rally began on 10/27/23, the performance of the S&P has been impressive:
- +28.5% with all 11 sectors posting double digit returns.
- Back-to-back quarters of double digit returns for the first time in 12 years.
- 5 straight months of positive performance.
- 17 of 22 weeks of positive performance.
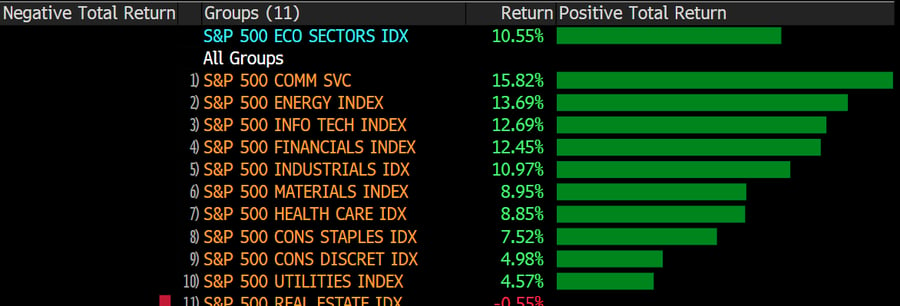
The momentum began with the “Fed pivot” but gained steam on the back of a better-than-expected earnings season and economic growth. Despite some macro headwinds during the quarter, the equity markets were fueled by lower cross asset volatility, strong equity market breadth and constructive outlook on inflation, growth, and Fed policy. The S&P 500 reached all-time highs in Q1 on its way to an impressive +10.6% return in the quarter. While we did some broadening out of market leadership, the main themes that drove returns in 2023 continued in Q124: large > small, growth > value, quality > risk. As Chart 1 illustrates, 5 of the 11 S&P Sectors outperformed the overall index returns in Q124.
Chart 1: Q1 SPX 500 sector returns.

The constructive macro backdrop continued to drive market returns as we saw solid multiple expansion. Resilient economic growth, positive sentiment on inflation, and a dovish Federal Reserve, continued to provide the green light for risk assets. However, the market headwinds and tailwinds did become a bit more balanced as the quarter progressed.
Market headwinds during the quarter:
- Higher rates: 10yr +32bp
- Rising Dollar: +3.1% ytd
- Rising oil prices: +15% ytd
- Equity valuations: elevated but not extreme
- Market technicals: 50 days in a row S&P closed in overbought territory—ties longest streak ever.
Market tailwinds during the quarter:
- Low Volatility:
VIX closed below 13 (10yr avg is 18.1)
MOVE closed at 86.3, -26% from one year high
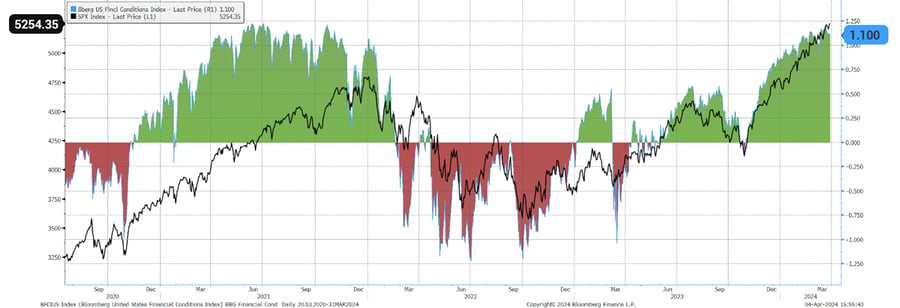
- Financial Conditions remain loose (Chart 2 below)
- Earnings optimism: S&P earnings expected to grow +10.4% in 2024
- Increase of market breadth: more stocks participating in the upward move
- Credit spreads: continue to tighten; recession probabilities moving lower
- “Dovish” Fed: Fed remains on track to cut rates in 2024
Chart 2: Easy financial conditions continue to catalyze equity returns

As Q124 progressed, the equity markets began to experience a rotation out of Early Cyclicals (Growth) and into Deep Cyclicals (Defensive). From February 1 to quarter end, Small Caps outperformed Large Caps and Value outperformed Growth, which helped give the market some needed momentum in the back half of the quarter.
Chart 3: SPX 500 Sector returns 2/1/24-3/29/24. Sector rotation.
Tactical Income Strategy Q124 Review
Throughout Q124, the Hilton Capital Investment Committee strategically capitalized on the favorable macroeconomic environment by continuing to increase market exposures within the Tactical Income Strategy. Commencing the year with a 43% allocation to equities, this allocation ascended to 48% by the close of the quarter. As delineated in Chart 4, the Investment Committee continued to tactically add risk to equities as the economic data confirmed positive trends on growth and inflation.
Chart 4: Tactical Income asset allocations January 1, 2023 – March 29, 2024
Chart 5 illustrates the sector rotations that have occurred in the Tactical Income Strategy since the beginning of 2023. A sizeable Treasury position has been used as a source of funds to deploy capital into cyclical equities and spread products within fixed income. These investment decisions have enabled the Tactical Income Strategy to have increased participation in the risk asset rally while also increasing the overall yield within the portfolio.
Chart 5: Tactical Income sector allocation changes January 1, 2023 – March 29, 2024
As emphasized earlier, the Tactical Income strategy has tactfully amplified portfolio risk exposure over time. By strategically augmenting allocations to both equity and credit spread positions, we have effectively broadened our exposure spectrum and leveraged the prevailing macro tailwinds to our advantage. Additionally, our committee has demonstrated proactive management by fine-tuning sector allocations, transitioning away from defensive sectors, and strategically reallocating capital towards promising cyclical and growth sectors.
Our primary objective has been to identify and invest in high-quality companies that exhibit resilience in maintaining margins and sustaining growth within the prevailing macroeconomic landscape. This disciplined approach underscores our commitment to delivering sustainable returns amidst evolving market conditions.
Chart 6 and 7 illustrate the sector moves within equity and fixed income since January 1, 2023--significant increases to Information Technology, Financials, Consumer Discretionary, Corporate Debt and Structured Debt.
Chart 6: TI Equity Sector allocations January 1, 2023 vs March 29, 2024
Chart 7: TI Fixed Income Sector allocations January 1, 2023 vs March 29, 2024
In the first quarter of 2024, the Hilton Tactical Income Strategy demonstrated robust performance, delivering returns of 4.72% gross and 4.60% net. This success can be attributed to our strategic decision to incrementally increase risk exposure throughout 2023 and Q124, allowing the strategy to capitalize on the rally in risk assets.
Notably, the Tactical Income Strategy outperformed the benchmark* by 71 basis points (bp) gross and 59 bp net. The outperformance vs the benchmark* can be attributed to overweight allocations in consumer discretionary, energy and preferred securities. This outperformance underscores the efficacy of our tactical approach in navigating market conditions.
Breaking down the +4.72% quarterly performance of Tactical Income, we observed a return of +4.5% from equities and +.22% from fixed income. The total return of the equity portfolio was 9.9% vs the SPX 500 return of +10.6%.
Chart 8: Absolute and Relative Performance vs Benchmark* for Q124
The Hilton Investment Committee's unwavering adaptability and dedication to our macro-centric and tactical approach have been instrumental in effectively responding to evolving economic data and Federal Reserve policy dynamics, ensuring our strategy remains well-positioned amidst market fluctuations.
Looking ahead, the Committee anticipates sustained economic growth with a gradual deceleration of inflation, as wage trends in key sectors suggest ongoing pressures that could influence broader inflationary dynamics. This scenario, characterized by nuanced wage growth patterns, may lead to increased market volatility while potentially supporting risk assets. Our approach centers on vigilant monitoring of economic indicators to enable timely tactical adjustments. By focusing on the interplay between wage growth and inflation within the evolving economic landscape, we aim to navigate through complexities with strategic foresight, ensuring our portfolio's alignment with anticipated monetary policy shifts and economic conditions.
All information set forth herein is as of March 31, 2024, unless otherwise noted. This email contains general information that is not suitable for everyone. The information contained herein should not be construed as personalized investment advice. There is no guarantee that the views and opinions expressed in this email will come to pass. Investing in the stock market involves gains and losses and may not be suitable for all investors. Information presented herein is subject to change without notice and should not be considered as a solicitation to buy or sell any security. Hilton Capital Management, LLC (“HCM”) is a registered investment adviser with its principal place of business in the State of New York. For additional information about HCM, including fees and services, send for our Form ADV using the contact information herein. Please read the Form ADV carefully before you invest or send money. Past performance is no guarantee of future results. All information set forth in this email is estimated and unaudited.
*Tactical Income Benchmark = 40% SPX TR Index / 60% Bloomberg Intermediate US Govt/Credit TR Index Value Unhedged. Please see the Tactical Income Presentation which contains full performance information as well as relevant legal and regulatory disclaimers.
