HCM Insights
Hard vs. Soft Landing: What’s the Difference?

The debate over whether the economy will eventually experience a “hard” or “soft” landing continues to dominate market attention. The extended supply chain dislocations, crippling inflation, and 16 months of Fed (Federal Open Market Committee) policy tightening have all contributed to an atmosphere of heightened theorizing about potential outcomes.
Adding fuel to the debate is the hard reality of historical precedent, in which periods leading into hard and soft landings often look very similarーbut only up to a point. As such, which scenario will ultimately close out the current economic cycle is anyone’s guess.
To help navigate the current environment, we outline the differences between soft and hard landings, the conditions required for each to manifest, and what recent data may be telling us.
Understanding the Flow of Restrictive Monetary Policy
In a previous blog post, we discussed how the impact of Fed rate hikes generally trickles through the economy, gradually putting downward pressure on prices over time.
More interest rate-sensitive sectors, such as housing (mortgage rates), lending, and corporate investment, are historically the first to feel the pinch. Weakening demand follows, impacting new orders, growth, and corporate earnings. From there, economic slowdowns are typically seen in employment data, with reduced job openings, increased layoffs, and higher unemployment rates.
The process can take months or even years to complete, and given the lag in impact, the Fed will typically conclude its tightening and “pivot” before the weight of its actions fully manifests.
A Fed ‘Pivot’ Is Not a ‘Landing’
Notably, a Fed pivot isn’t necessarily the end of an economic slowdown, otherwise known as a “landing.” That occurs when the totality of Fed action has been absorbed into the economy and culminates first in housing activity (the demand for new building permits) followed by the impact on employment.
This description may seem counterintuitive since mortgage rate increases occur at the beginning of a restrictive cycle. However, the demand for new building permits can function as a leading indicator that reveals the aggregate effect of Fed tightening over time.
Additionally, a bottoming out in housing activity signals a landing regardless of whether the landing is hard or soft. The distinction between the two scenarios lies in the depth of the bottom reached and subsequent labor market movement.
What Is a Soft Landing?
In a soft-landing scenario, the economy experiences a gradual and controlled slowdown, punctuated by easing inflation, labor markets, and lending standards in response to Fed action and without a sharp or severe downturn.
Within this context, at the point of the Fed pivot, securities markets typically pick up. This is due to renewed optimism that rate hikes are expected to end soon. Leading into this so-called relief rally, mortgage rates will decline, and housing activity will increase.
What Has to Happen for a Soft Landing to Occur?
For a soft landing to occur, the trajectory of increasing housing demand will continue to climb, signaling that previous lows were, in fact, bottom levels. Additionally, employment will stabilize or improve. In short, inflation has been tamed without significant increases in unemployment or other labor shocks, and declines in consumer spending or negative GDP growth have been avoided.
What Is a Hard Landing?
Conversely, a hard landing is characterized by a pronounced contraction of economic activity, leading to significant negative consequences for employment and overall economic health. Highly volatile food and energy inflation will often spike, and lending standards tighten. Overall, Fed action proves to be “too restrictive” and leads to a recession.
Interestingly, the lead-up to a hard landing looks nearly the same as for a soft landing. Even in a hard landing scenario, a Fed pivot is generally followed by a relief rally for all the same reasons described above.
What Has to Happen for a Hard Landing to Occur?
Here, the upward trajectory in housing demand described in a soft-landing scenario is short-lived: Instead of continuing to improve, housing activity will bounce, with an initial improvement followed by significant declines. Deterioration of employment health, characterized by declining wage growth, higher jobless claims, and increasing unemployment rates, continues.
When housing activity finally bottoms out, it will be lower than that in a soft-landing scenario.
Where Are We Now?
Have We Reached the Fed “Pivot Window?”
As measured by the National Association of Home Builders/Wells Fargo Housing Market Index (NAHB Index or HMI), current housing activity appears to be on a modest upswing一a significant precondition to both soft and hard landings.
More specifically, the NAHB Index measures homebuilder confidence in the U.S. residential real estate market based on their assessment of current and future conditions for the sale of new homes and prospective buyer traffic.
These elevating levels could suggest the Fed is nearing the end of its restrictive policy action with a potential landing on the horizon一colloquially referred to as the “Fed Pivot Window”一with the understanding that at least one additional rate hike is likely in the cards for 2023.
NAHB/Wells Fargo Housing Market Index
August, 2021 through July, 2023

Source: The National Association of Home Builders.
NOTE: The index is measured on a scale from 0 to 100, where a reading above 50 indicates favorable sentiment, and a reading below 50 suggests negative sentiment.
Regardless, It’s Still Too Early To Tell the Outcome
That said, a clear throughline in the data has yet to emerge. In his post-FOMC meeting remarks in July, Fed Chairman Jerome Powell outlined a decidedly mixed picture of economic conditions.
While the rate of economic growth shows signs of slowing down, inflation, as measured by the Personal Consumption Expenditures (PCE) Price Index, remains at 3%, well above the Fed’s target rate of 2%. Additionally, the economy faces increasing headwinds as credit conditions tighten一yet importantly一labor markets, while loosening, remain tight.
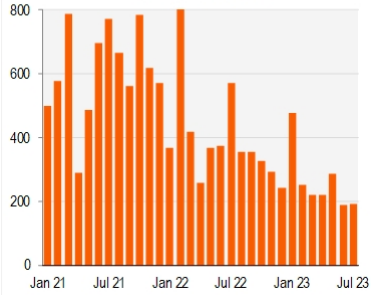
For example, total nonfarm payroll employment rose by 187,000 jobs last month, just under expectations of 200,000 and still at a relatively robust level. And while there is some narrowing across sectorsーnearly a third of new jobs were in healthcare while manufacturing and transportation/warehousing were essentially flatーJuly clocked in as the 31st consecutive month of job growth.
U.S. Total Nonfarm Payroll Employment
January, 2021 to July, 2023

Source: Piper Sandler, U.S. Bureau of Labor Statistics.
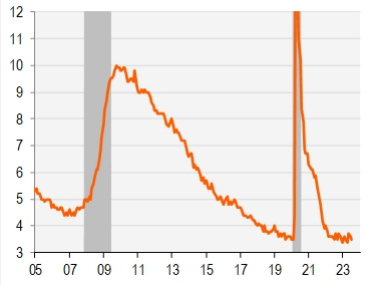
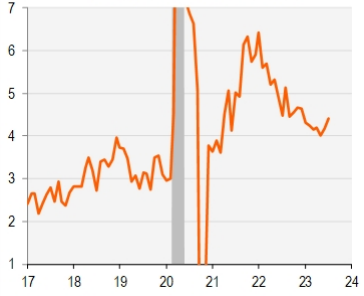
Unemployment and wage inflation also remain resilient. July’s unemployment rate dropped 0.1% to a historically low 3.5%, as average hourly wages grew 0.4% in June to a 4.4% year-on-year increase.
U.S. Unemployment Rate
January, 2005 to July, 2023

Source: Piper Sandler, U.S. Bureau of Labor Statistics.
U.S. Average Hourly Earnings
January, 2017 to June, 2023

Source: Piper Sandler, U.S. Bureau of Labor Statistics.
All Eyes on Employment
Finally, whether the Fed can further temper a still zealous employment market without smothering it altogether remains the key question to what comes next. And as the current data suggests, additional tightening may be necessary, increasing the probability of a hard landing after all. Only time will tell.


