HCM Insights

The second quarter of 2024 presented numerous economic cross currents, leading to mixed outcomes across different sectors, companies, and the broader market. The ongoing trend of disinflation, coupled with above-trend growth and optimistic earnings expectations, buoyed certain asset classes and sectors. However, the Federal Reserve's "higher for longer" restrictive monetary policy continued to exert downward pressure on many companies and economic sectors.
Investors who strategically selected the appropriate asset classes, sectors, styles, and factors were rewarded with solid relative returns. Despite a generally supportive macroeconomic environment, the quarter was marked by challenging technical indicators, stretched valuations, low correlation, and narrow market breadth. This was not a quarter where a “rising tide lifted all boats”; some investments were left behind.
Higher interest rates and interest rate volatility produced a bifurcation in quarterly returns: Large Cap > Small Cap, Growth > Value, High Quality > Low Quality, Cyclicals > Defensive. Investors who made the right “bets” were rewarded. As the charts below indicate, returns were concentrated in the Large Cap, Higher Quality names and the technology/AI theme continued to drive returns. Investors favored companies with constructive earnings outlooks, which created multiple expansion in both the S&P 500 and the Nasdaq. The S&P 500 made 31 new all-time highs during the first half of 2024. The S&P equal weight and small caps continued to lag.
Chart 1: Equity Indices Q2 Returns
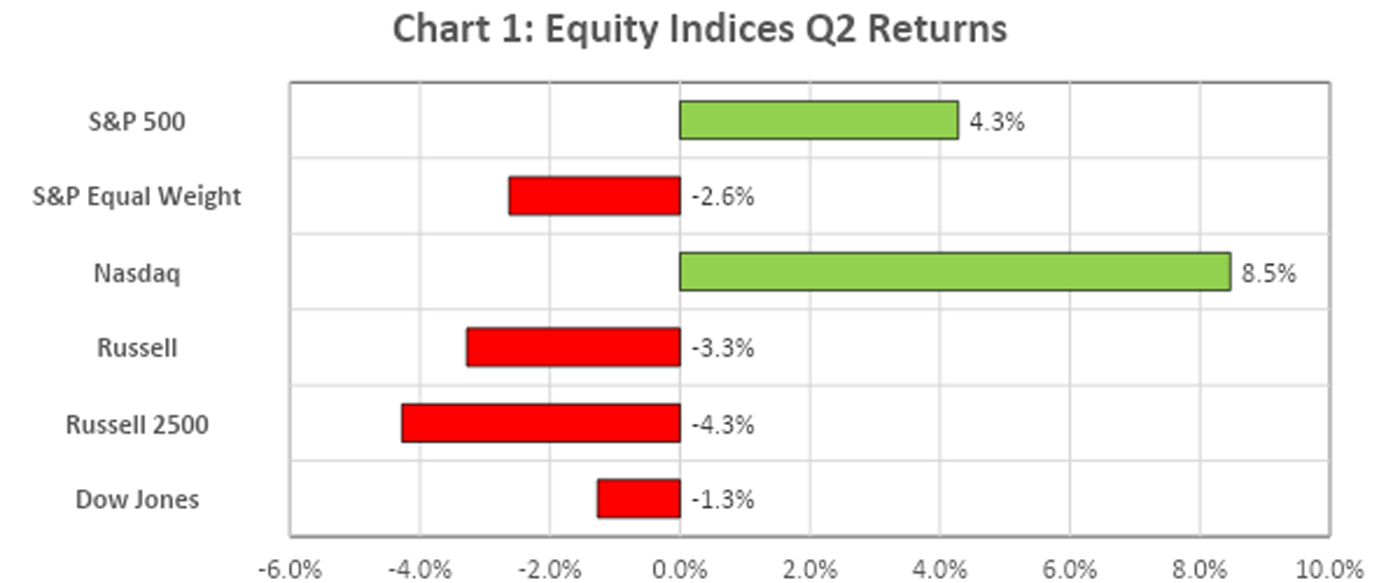
Chart 1: Equity Indices Q2 Returns
Source: Bloomberg
Chart 2: 2024 Has Been One of the BEST H1s For Large Caps—SPX 500
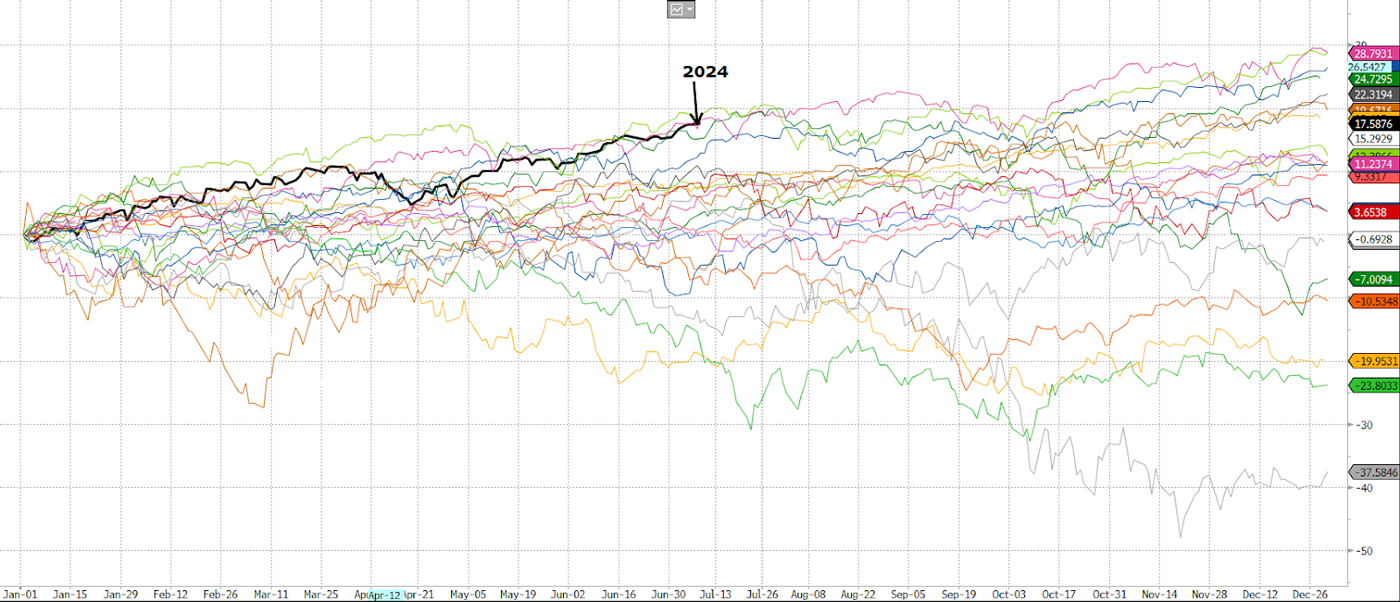
Chart 2: 2024 Has Been One of the BEST H1s For Large Caps—SPX 500
Source: Bloomberg
Chart 3: Yet One of the WORST H1s for Small Caps—S&P 600
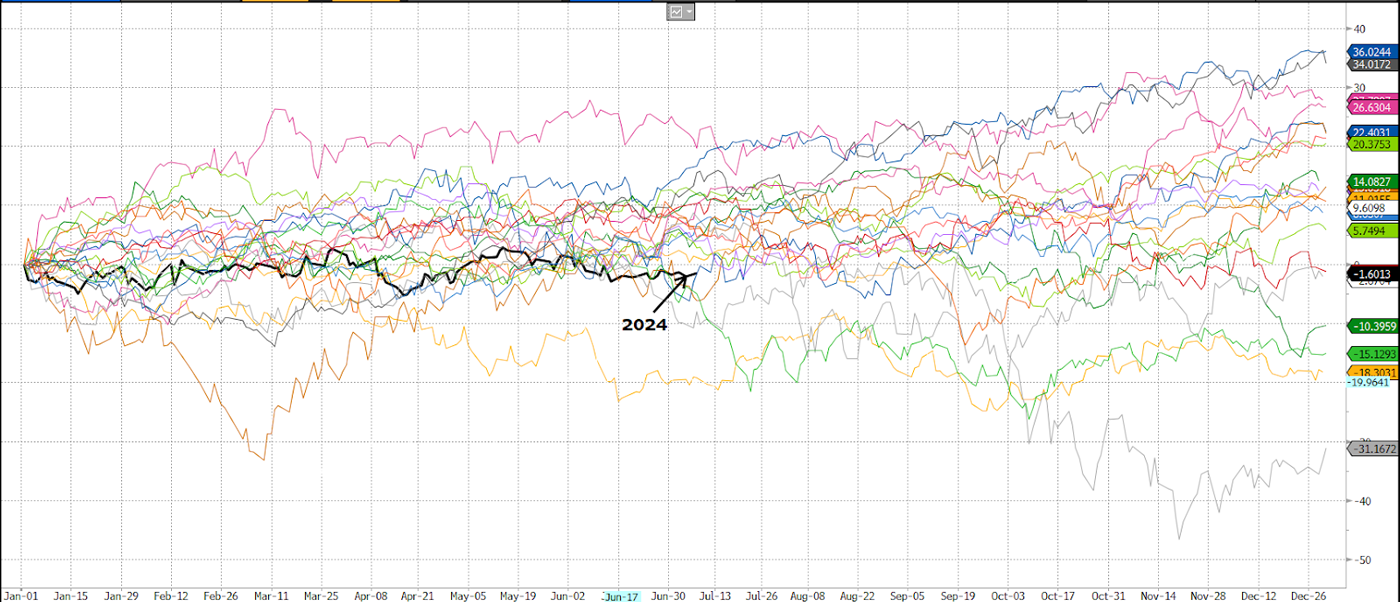
Chart 3: Yet One of the WORST H1s for Small Caps—S&P 600
Source: Bloomberg
Chart 4: Market Bifurcation: Small Cap Stocks / Large Cap Stocks
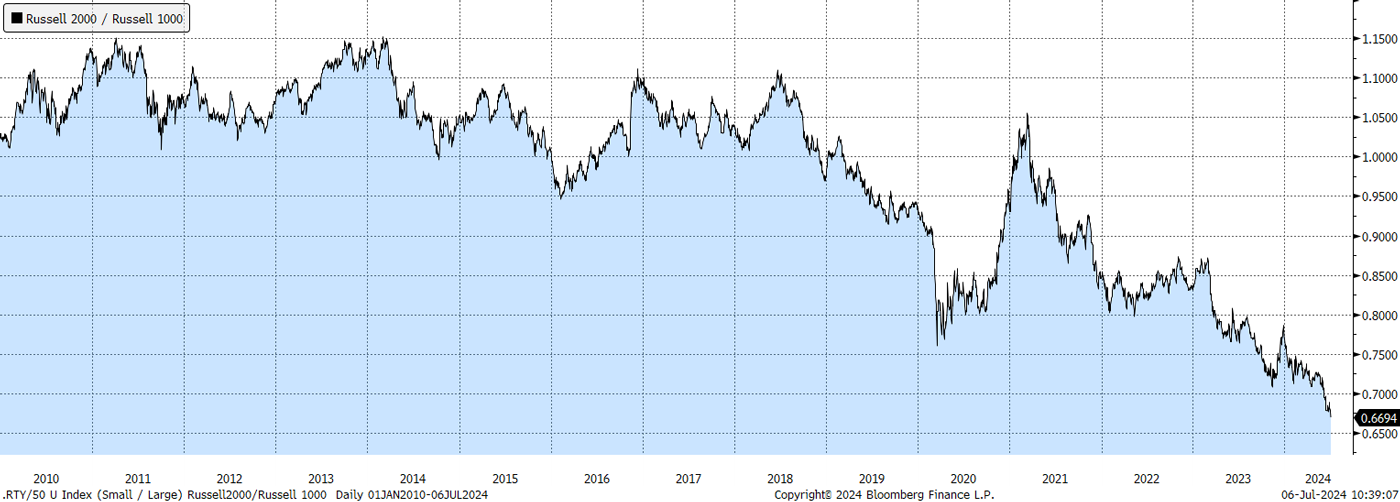
Chart 4: Market Bifurcation: Small Cap Stocks / Large Cap Stocks
Source: Bloomberg
During Q2, the markets reacted to each economic release as investors continued to navigate the soft landing/hard landing narratives. As a result, market moves were choppy, quarterly returns were concentrated, and market breadth continued to deteriorate. The S&P 500 experienced 28 negative days and 35 positive days of performance, with 6 days of returns > 1% and 4 days of returns < 1%. As Chart 5 indicates, only 3 of the 11 sectors outperformed the S&P 500 return of 4.3%, and only 27% of the individual stocks in the S&P 500 outperformed the index during the quarter.
Chart 5: Equity Sector Q2 Returns
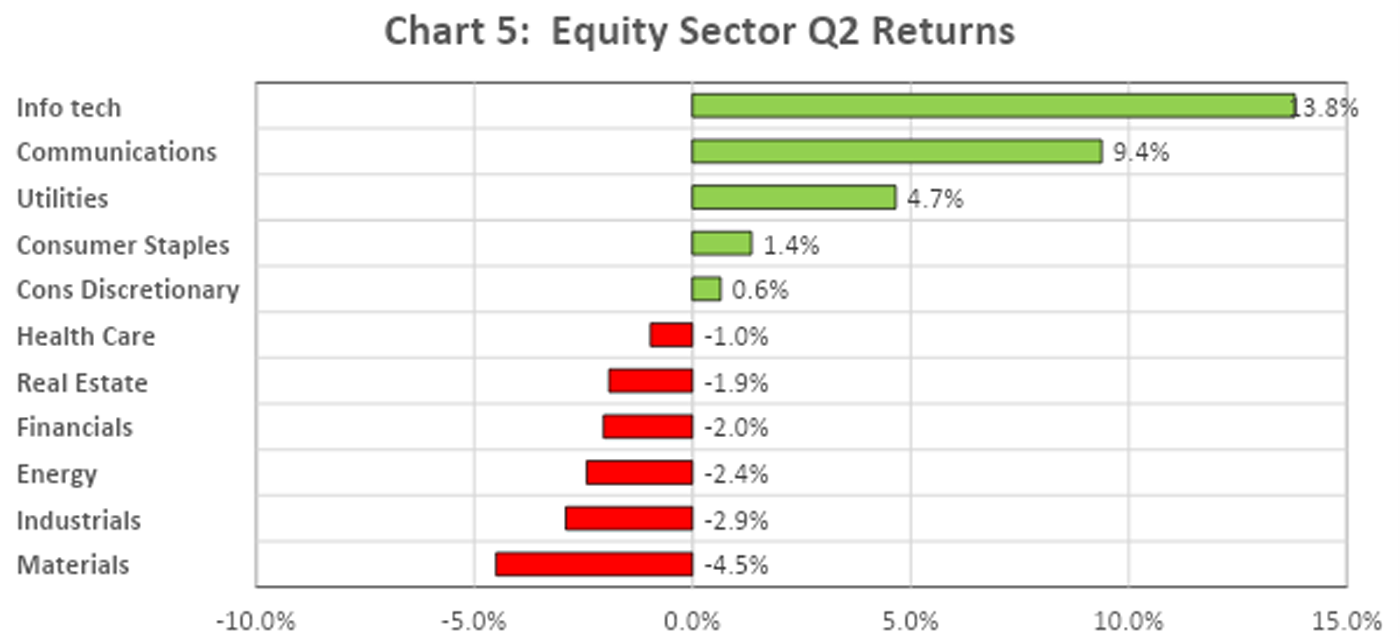
Chart 5: Equity Sector Q2 Returns
Source: Bloomberg
Despite the S&P 500 Index making 9 new all-time highs during the quarter, only 25% of the stocks within the index made new all-time highs. And only 12.5% of the S&P 600 made new all-time highs during the quarter. The narrow breadth has been a function of “higher for longer” rates and a bifurcated earnings backdrop.
Chart 6: Lack of Market Breadth: S&P 500 Equal Weight / S&P 500
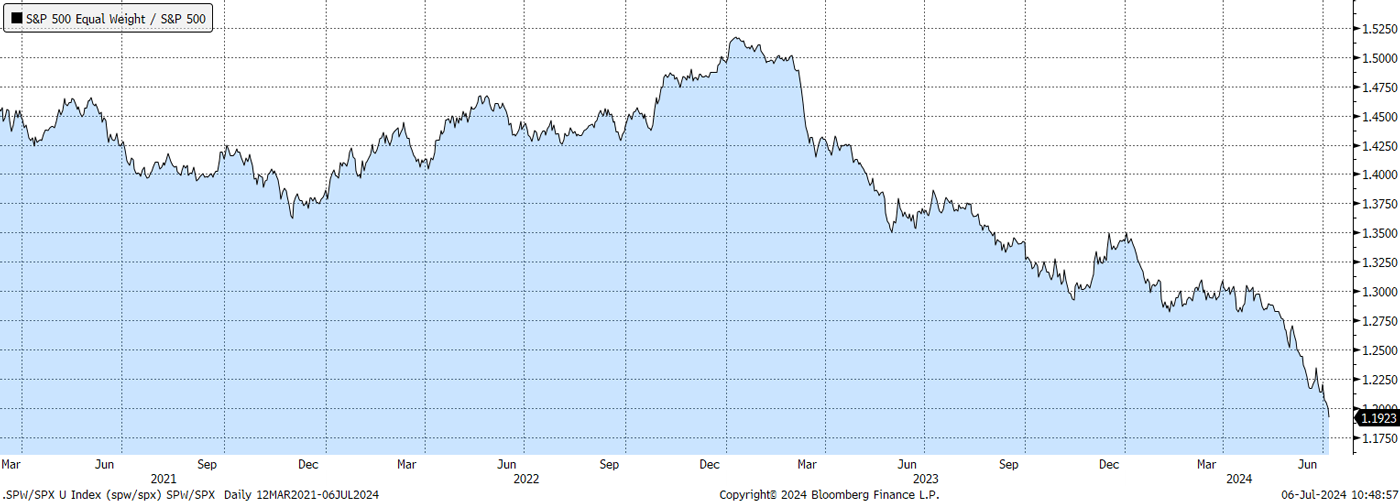
Chart 6: Lack of Market Breadth: S&P 500 Equal Weight / S&P 500
Source: Bloomberg
Market tailwinds during the quarter:
- Disinflation trend: Core PCE at 2.6%.
- Earnings optimism: Expected Q2 Earnings growth 8.6%, Q3 8.2%.
- Financial Conditions: Financial conditions remain loose/accommodative.
- Low Volatility: VIX closed at 12.44 and Credit Spreads remain steady.
Market headwinds during the quarter:
- Higher rates: 10yr +18bp.
- Rising Dollar: Dollar +1.7% in June.
- Rising oil prices: Oil +6.3% in June.
- Interest rate volatility: MOVE index +14.1% in Q2.
- Equity valuations: SPX P/E expanded 1pt, Nasdaq 2pts, both significantly above 10yr avg.
- Market breadth: Top 10 companies in S&P highest weight since 1929.
- Cracks in labor market: Unemployment rate and claims trending higher.
- Slowing growth? Still above trend but slowing from robust levels.
Tactical Income Strategy Q224 Review
During Q224, the Hilton Capital Investment Committee maintained a steady level of risk in the portfolio, making only minor allocation adjustments. Asset allocations were similar to the end of Q1: 2.6% Cash, 48% Equities and 49.4% Fixed Income. After tactically increasing the level of risk in the portfolio through Q124, the Committee has remained patient, feeling the portfolio represents the appropriate risk/reward profile given the current economic backdrop. The Standard Deviation is roughly 5% which is below the historical mark of 6.5% and the yield in the portfolio is 4.52%.
Chart 7: Tactical Income asset allocations January 1, 2023 – June 30, 2024
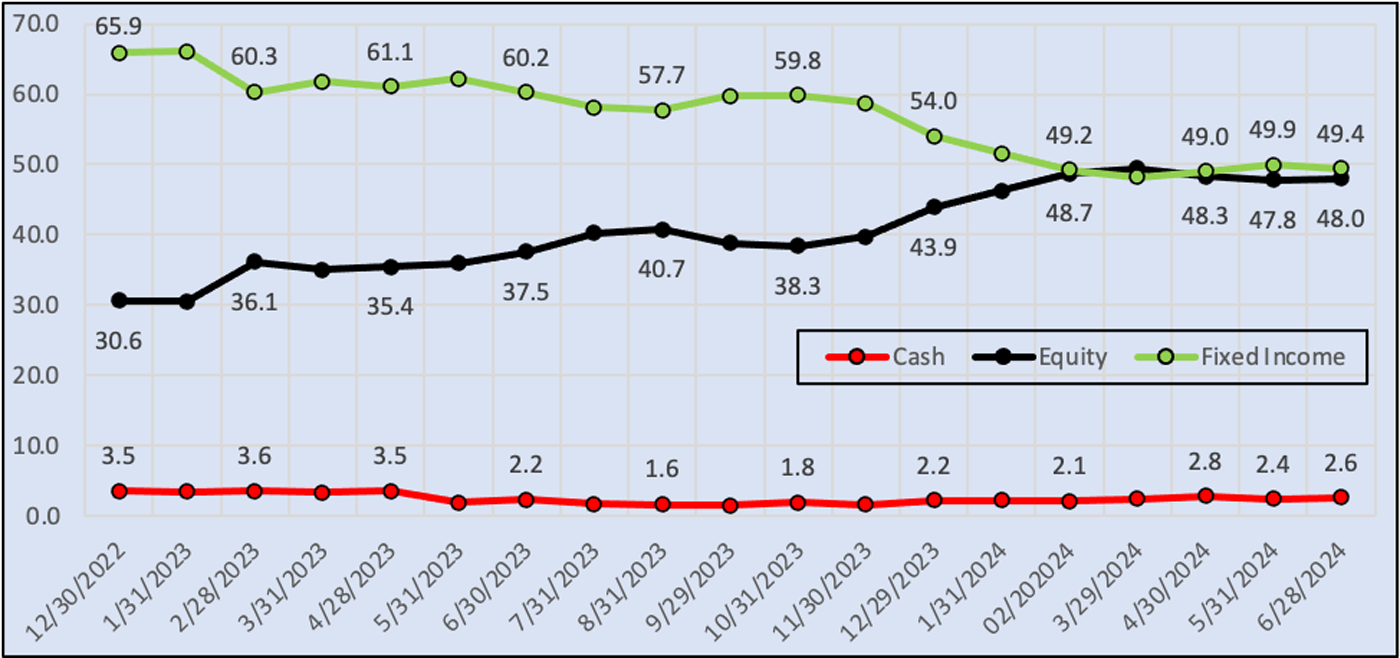
Chart 7: Tactical Income asset allocations January 1, 2023 – June 30, 2024
In fixed income, the Committee continued to sell down the treasury position and use the proceeds to initiate a 3.5% position in Short Term High Yield (Chart 8). In equities, 0.7% was added to the Energy sector which is now a 2% overweight vs. the benchmark (Chart 9).
Chart 8: Tactical Income Q224 sector allocation changes
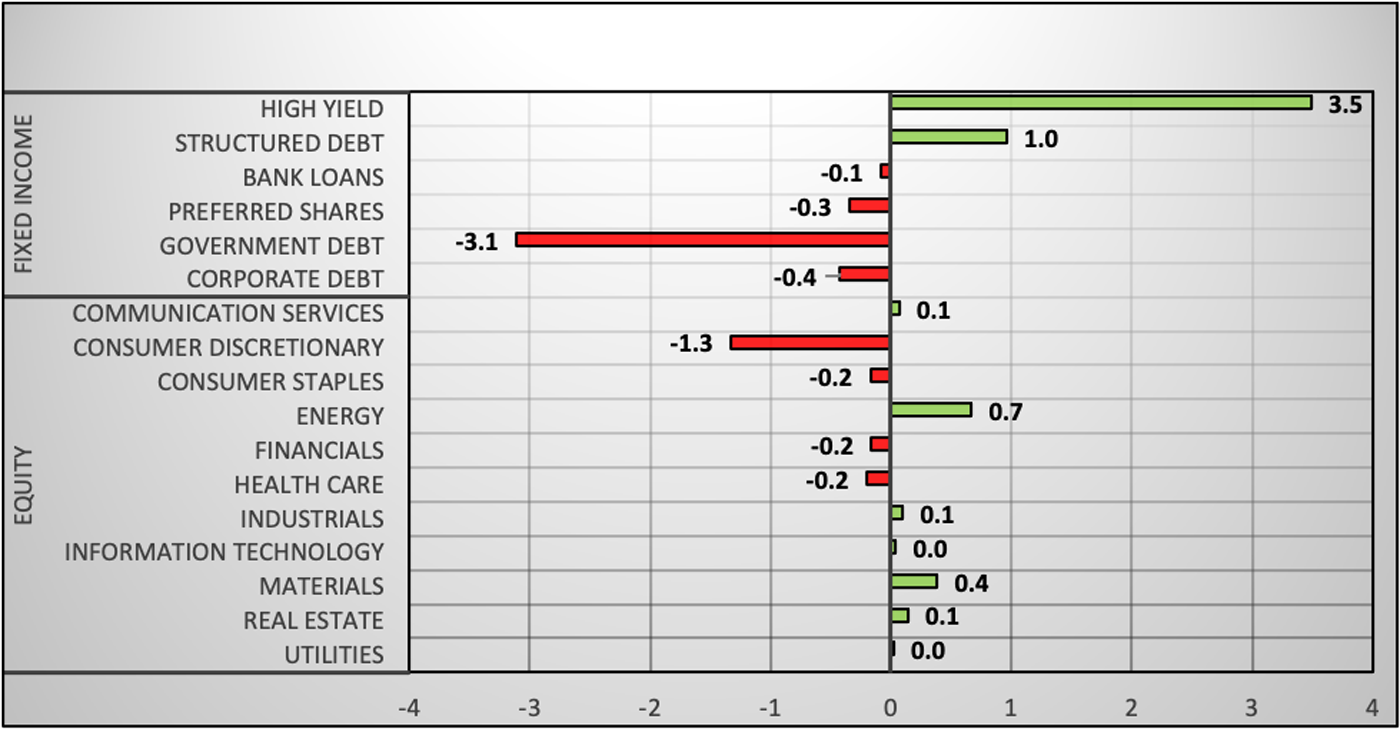
Chart 8: Tactical Income Q224 sector allocation changes
Chart 9: Tactical Income Sector Weights vs Benchmark
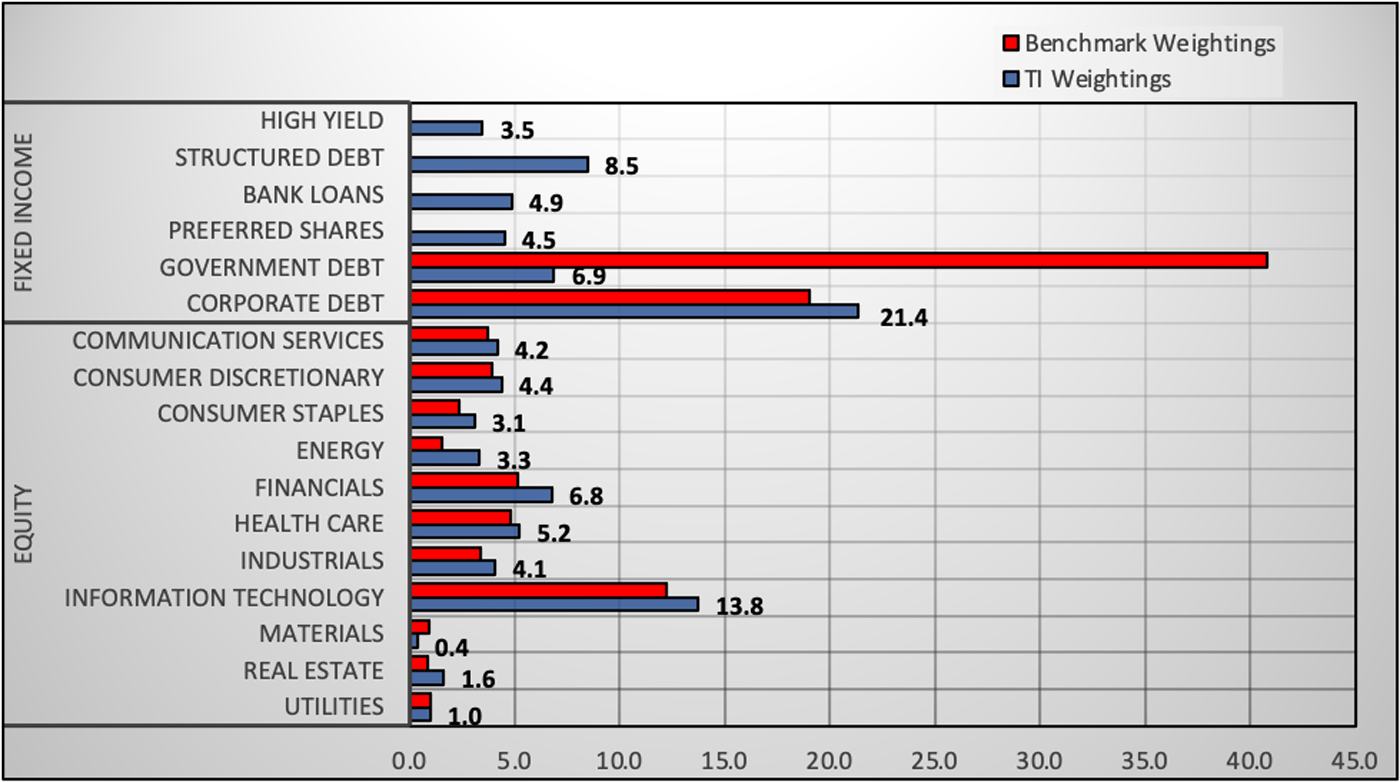
Chart 9: Tactical Income Sector Weights vs Benchmark
The Investment Committee believes the portfolio has the proper asset and sector allocation mix to effectively navigate the current backdrop. Their primary objective has been to identify and invest in high-quality companies that exhibit resilience in maintaining margins and sustaining growth in the prevailing economic landscape. This disciplined approach underscores our commitment to delivering sustainable returns amidst evolving market conditions.
These strategic allocation decisions produced solid results. In the second quarter of 2024, the Hilton Tactical Income Strategy outperformed both of its benchmarks (Chart 10). As of January 1, 2024, the Investment Committee adopted the Morningstar Moderately Conservative Target Risk Index (MSAAMMCR) as a secondary benchmark. We believe this index more accurately reflects the asset allocation, level of risk and historical performance of the Tactical Income Strategy and does not have the sector concentration levels inherent in the modern version of the S&P 500 which is part of our historical blended benchmark.
Chart 10: Tactical Income Q224 Gross/Net Performance vs Benchmarks
| Q224 | Q224 | Difference | Difference | |
| Gross | Net | Gross | Net | |
| Hilton Tactical Income Strategy | 2.4% | 2.2% | ||
| *Benchmark (60% BGCI, 40% S&P 500 TR) | 2.1% | 2.1% | 0.3% | 0.1% |
| Morningstar Moderately Conservative Tgt Risk Index | 0.4% | 0.4% | 2.0% | 1.8% |
Please see the Tactical Income Factsheet on our website for full performance information.
The quarterly results can be attributed to maintaining a higher level of market exposure with a focus on larger cap and higher quality companies. This enabled the Tactical Income strategy to participate in the dominant market trends throughout the quarter. Equities contributed 1.9% to the total return and Fixed Income 0.5%. The top contributing sectors were Information Technology, Health Care, and Communication Services.
YTD 2024, the Tactical Income Strategy has achieved a very solid return vs both benchmarks. The portfolio has averaged a 47% equity allocation throughout 2024, which has been a key factor in driving relative outperformance. Again, the focus on large cap and high-quality names has enabled the portfolio to maintain a risk overweight and optimize returns.
Chart 11: Tactical Income YTD Gross/Net Performance vs Benchmarks
| YTD | YTD | Difference | Difference | |
| Gross | Net | Gross | Net | |
| Hilton Tactical Income Strategy | 7.1% | 6.8% | ||
| *Benchmark (60% BGCI, 40% S&P 500 TR) | 6.2% | 6.2% | 0.9% | 0.6% |
| Morningstar Moderately Conservative Tgt Risk Index | 0.4% | 0.4% | 6.7% | 6.4% |
Please see the Tactical Income Factsheet on our website for full performance information.
Outlook
The Hilton Investment Committee will continue to follow the macro-centric and tactical approach that has been instrumental in effectively responding to evolving economic data and Federal Reserve policy dynamics. We believe our strategy remains well-positioned amidst market fluctuations. Our approach centers on vigilant monitoring of economic indicators to enable timely tactical adjustments.
The restrictive policies of the Federal Reserve are having an impact on the economic data. “Higher for Longer” is impacting inflation and growth and is beginning to affect the labor market. Progress is being made as the Federal Reserve continues to aim for the “soft landing”. While inflation has been a bumpy ride, the disinflation trend has continued — Core PCE at 2.6%. Resilient economic growth has been slowing with the most recent Atlanta Fed GDP forecast of 1.5%. Additionally, we are beginning to see cracks in the labor market data—unemployment rate and claims trending higher; quit rates, hiring rates, hours worked all trending lower. While the data is softening, there are no indications of an imminent recession. The economic data, combined with the potential “Fed Put,” justify maintaining the current level of risk in the portfolio. However, the Investment Committee does not have strong conviction on the short-term direction of the markets at this point. Recent data on growth and labor, cross-asset volatility measures, and market technicals indicate the choppy ride in the economy and the markets may continue. However, we believe our above-neutral allocation to equities and focus on high-quality equities is the appropriate positioning for the projected environment.
All information set forth herein is as of June 30th, 2024, unless otherwise noted. This letter contains general information that is not suitable for everyone. The information contained herein should not be construed as personalized investment advice. There is no guarantee that the views and opinions expressed herein will come to pass. Investing in the stock market involves gains and losses and may not be suitable for all investors. Information presented herein is subject to change without notice and should not be considered as a solicitation to buy or sell any security. Hilton Capital Management, LLC (“HCM”) is a registered investment adviser with its principal place of business in the State of New York. For additional information about HCM, including fees and services, send for our Form ADV using the contact information herein. Please read the Form ADV carefully before you invest or send money. Past performance is no guarantee of future results. All information set forth herein is estimated and unaudited.
*Tactical Income Benchmark = 40% SPX TR Index / 60% Bloomberg Intermediate US Govt/Credit TR Index Value Unhedged. Please see the Tactical Income Factsheet which contains full performance information as well as relevant legal and regulatory disclaimers.